Accuracy of Surgical Navigation using MiniCAT 2020 In-Office CT
Xoran Technologies, Ann Arbor, MI, in collaboration with Fiagon GMBH, Berlin Germany
Keywords: in-office CT, IGS, image guided surgery, navigation, registration, computed tomography, Xoran, Fiagon, MiniCAT
Abstract: In-office Computed Tomography (CT) scanners are used to support image-guided surgery (IGS) of the paranasal sinuses and skull base as well as office-based procedures such as balloon sinuplasty. Image-to-pointer accuracy needs regular re-evaluation as systems improve. This pre-clinical study evaluates the accuracy of image-guided surgical navigation using images from the MiniCAT™ 2020 CT scanner. A phantom with radio-opaque markers was scanned with multiple scan parameters and the images transferred to a Fiagon electromagnetic navigation system. These systems were used to demonstrate submillimeter positional accuracy when navigating the paranasal sinuses.
Methods: A head phantom (Fiagon) with realistic bony sinus anatomy and facial features was used for imaging and navigation tests. Radio-opaque spherical markers (CT-Spots, Beekly Medical) were embedded as target points into the phantom sinus anatomy and used to measure field tracking accuracy. Office based CT scans were obtained from a Xoran MiniCAT™ 2020 (Xoran Technologies, Ann Arbor, MI), and transferred to an electromagnetic IGS system (Fiagon GmbH, Berlin). A total of five CT protocols on the MiniCAT 2020 system were used. Tube voltage was held constant; however, the number of projection frames, mA and reconstruction parameters were varied. For each test, the reconstructed image volume of the head phantom was transferred in high-resolution DICOM format to the Fiagon system and registered using standard surface registration methods. To evaluate target registration error (TRE), the radio-opaque spheres at different positions within the head phantom were touched with a tracked probe (Fiagon FlexPointer™). A 5.5 mm endoscope and tactile feedback were used to visually confirm that the probe tip was physically touching the surface of each sphere. TRE was estimated by measuring the distance from the center of each sphere to the location of the probe on the digital display, and then subtracting the radius of the sphere. All TRE measurements were made by two individuals.
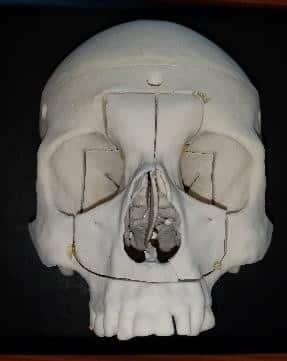
Image 1: Phantom with Radio-opaque Target Spheres and the MiniCAT™ 2020
|
Phantom with face removed showing fiducials in sinuses |
|
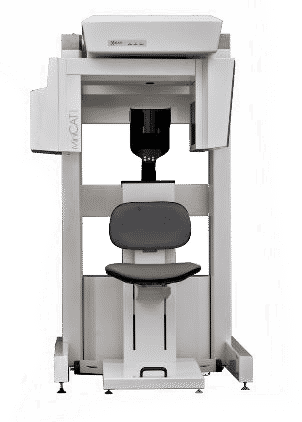 MiniCAT™ 2020 MiniCAT™ 2020Point-of-care CT scanner |
Imaging Parameters: The acquisition and reconstruction parameters are based on standard settings available on the MiniCAT™ 2020 CT scanner. The phantom was scanned using each of the three acquisition techniques and two additional reconstruction methods with smaller voxels. Axial slices from each image volume were exported as DICOM 3.0, with pitch and thickness to match the voxel size, to a USB drive and imported to the Fiagon system. A surface matching registration method was used to register the phantom.
Table 1: Imaging Parameters
|
Imaging Protocol |
Technique: (KvP / mA) |
Tube Current (mAs) | # of Projection Frames | Scan Time (s) | Reconstruction Voxel Size |
|
1 |
120 / 5.8 |
48.3 | 600 | 20 | 0.4mm |
| 2 | 120 / 5.8 | 36.2 | 450 | 15 | 0.4mm |
| 3 | 120 / 4.7 | 24.2 | 450 | 15 | 0.4mm |
| 4 | 120 / 5.8 | 48.3 | 600 | 20 |
0.3mm |
| 5 | 120 / 5.8 | 48.3 | 600 | 20 |
0.2mm |
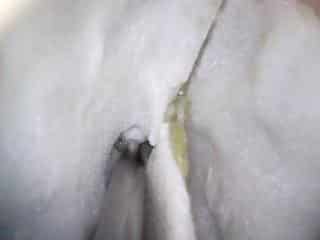
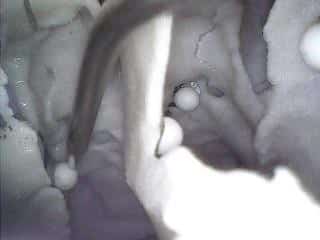
After each imported scan was registered, an endoscope was used to visually locate each of the marker spheres. The Fiagon Flex Pointer was used to touch the surface of each sphere, using the endoscope and tactile feedback to confirm that the tip was in fact on the sphere surface. A measuring tool within the Fiagon software was used to measure the distance from the location of the tip of the Flex Pointer to the location of the sphere center. The 2.0 mm radius of the sphere was subtracted from the measurement to provide an estimate of the radial difference between tracked and actual probe tip position. Image 2 shows example screenshots taken on the Fiagon IGS system showing the measured location of tool tip relative to the radio-opaque sphere at each targeted position. Image 3 shows a sample screen shot of the measurement technique. TRE measurements are shown in Table 2.
Image 2: Endoscopic Verification of Test Positions
 1. Right Frontal Ostium 1. Right Frontal Ostium |
 2. Right Maxillary Sinus 2. Right Maxillary Sinus |
 3. Right Palatine 3. Right Palatine |
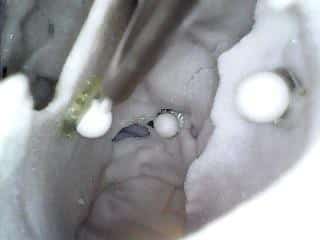 4. Left Septum 4. Left Septum |
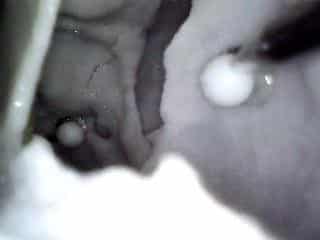 5. Left Lacrimal 5. Left Lacrimal |
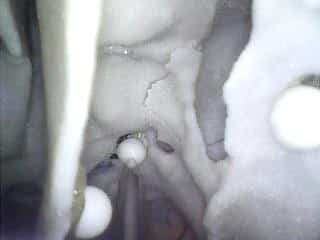 6. Left Anterior Sphenoid 6. Left Anterior Sphenoid |
Image 3: IGS System Measurements
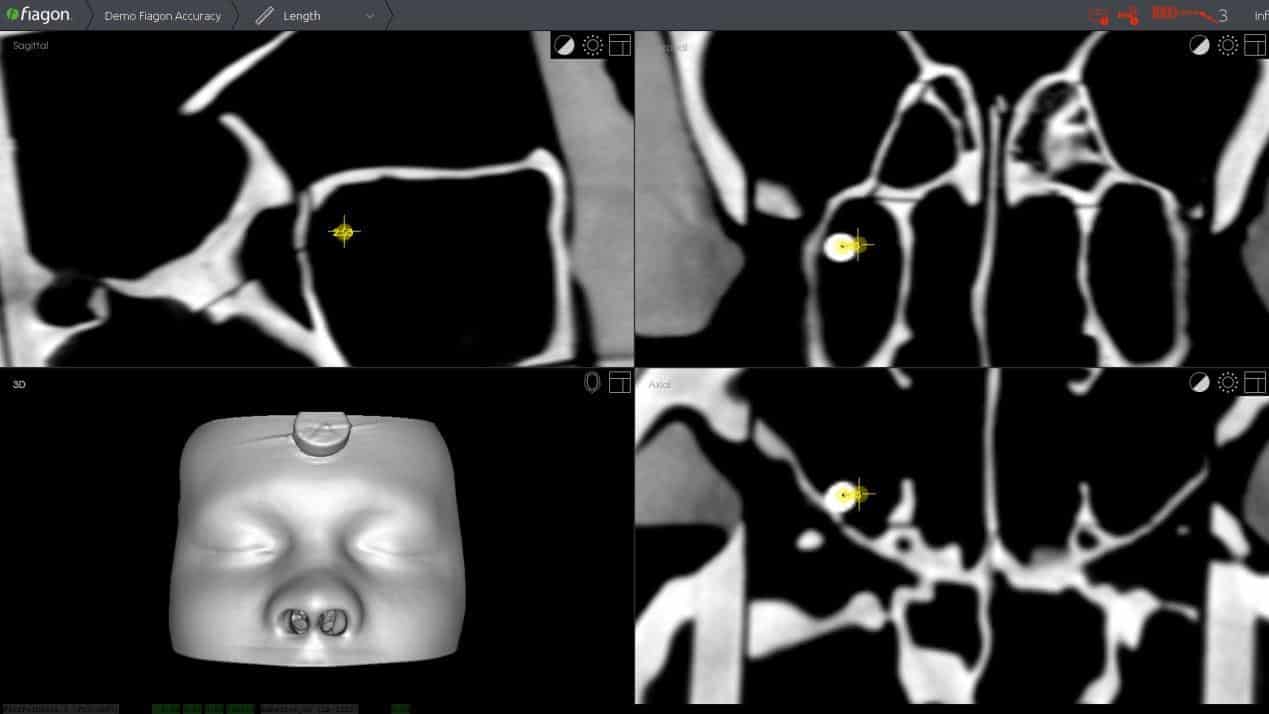 |
Table 2: Scan Accuracy Measurements (All measurements are in mm)
| Tester #1 | Location 1 | Location 2 | Location 3 | Location 4 | Location 5 | Location 6 | Average |
| Protocol 1 | 0.47 | 0.24 | 0.11 | 0.36 | 0.32 | 0.70 | 0.37 |
| Protocol 2 | 0.69 | 0.41 | 0.83 | 0.67 | 0.39 | 0.40 | 0.57 |
| Protocol 3 | 1.07 | 0.26 | 0.57 | 0.63 | 0.35 | 0.57 | 0.58 |
| Protocol 4 | 0.13 | 0.53 | 0.70 | 0.91 | 0.39 | 0.35 | 0.50 |
| Protocol 5 | 0.10 | 0.45 | 0.56 | 0.58 | 0.04 | 0.58 | 0.39 |
| Average | 0.49 | 0.38 | 0.55 | 0.63 | 0.30 | 0.52 | 0.48 |
| Tester #2 | Location 1 | Location 2 | Location 3 | Location 4 | Location 5 | Location 6 | Average |
| Protocol 1 | 0.14 | 0.10 | 0.07 | 0.49 | 0.13 | 0.17 | 0.18 |
| Protocol 2 | 0.10 | 0.23 | 0.70 | 0.02 | 0.46 | 0.19 | 0.28 |
| Protocol 3 | 0.34 | 0.34 | 0.70 | 0.70 | 0.08 | 0.14 | 0.38 |
| Protocol 4 | 0.84 | 0.30 | 0.98 | 0.80 | 0.14 | 1.00 | 0.68 |
| Protocol 5 | 0.57 | 0.45 | 0.92 | 0.75 | 0.26 | 0.74 | 0.62 |
| Average | 0.40 | 0.28 | 0.67 | 0.55 | 0.21 | 0.45 | 0.43 |
 |
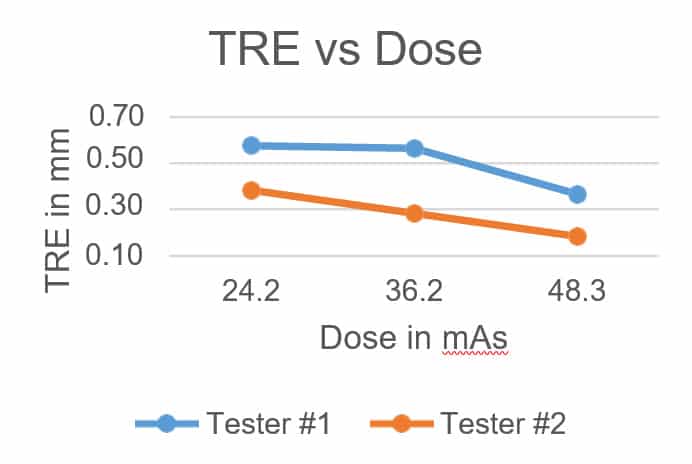 |
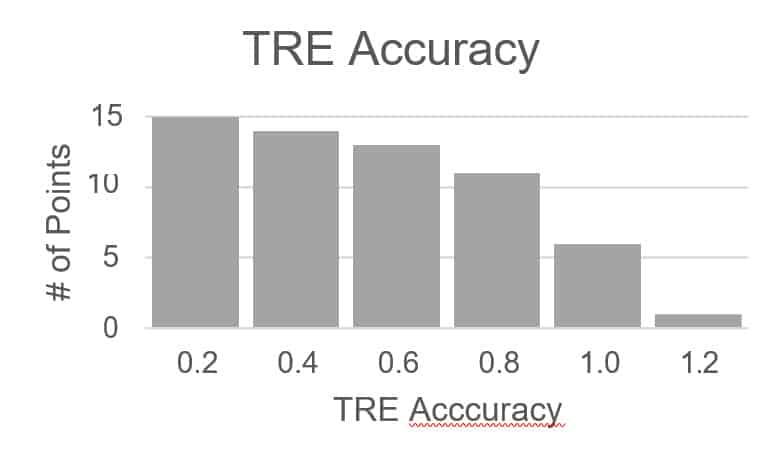
Left: Histogram of all TRE measurements with 0.2 mm wide histogram bins. Right: The average TRE for each tester plotted against tube current (mAs), showing that as X-ray dose increases, error decreases.
Discussion: The average of all TRE values measured was 0.45 mm. The standard techniques (1) and (2) provided an error less than 1 mm for all test data points. Overall, the average TRE value was around 0.5 mm at each test location. The low dose technique (3) appears to correlate with a small amount of incremental error that remains under the 1.0 mm limit, the only exception being the frontal sinus outflow, where the TRE was measured to be 1.07 mm. Reconstructions (4) and (5) with smaller voxel sizes (0.3 and
0.2 mm) are associated with an increase in the reconstruction and data transfer times, but did not improve the navigation accuracy. In fact, the average error increased compared to the same dose technique (1) with the standard voxel size of 0.4 mm. There did not appear to be a significant difference in average accuracy between the two testers.
Limitations: The accuracy measurements depend upon the quality of the registration. For this test, registration accuracy was not recorded. User skill is also a factor. The scope of this study was limited to two testers. The TRE measurement method used is a three-dimensional vector measurement; however, it only captures the radial component of distance from sphere center. Alternative methods could provide a more robust TRE measurement.
Conclusion: The results show that MiniCAT™ 2020 CT scanner used in conjunction with Fiagon IGS provide surgical image guidance with an average accuracy of 0.5 mm in the paranasal sinuses. All standard techniques evaluated produced images with sufficient quality to support submillimeter electromagnetic image guidance.
Acknowledgement: We would like to thank Fiagon GmbH for providing us their surgical navigation system and for the support interfacing with MiniCAT™ 2020 to perform the tests.
| Download the White Paper PDF. |
60184-01-2018